Data Analysis Tools
Elaticsearch (Elk Stack)
If you have A lot of data to collect and analyze. Then the elastic stack is for you. With all programs in the elk stacks you can:
Collect Data
- collect log Data (with filebeat)
- collect Metrics (with meticbeat)
- insert and query your own Data (via json REST api
Visualize Data
- Kibana is your Vizualization Tool in the elastic Stack
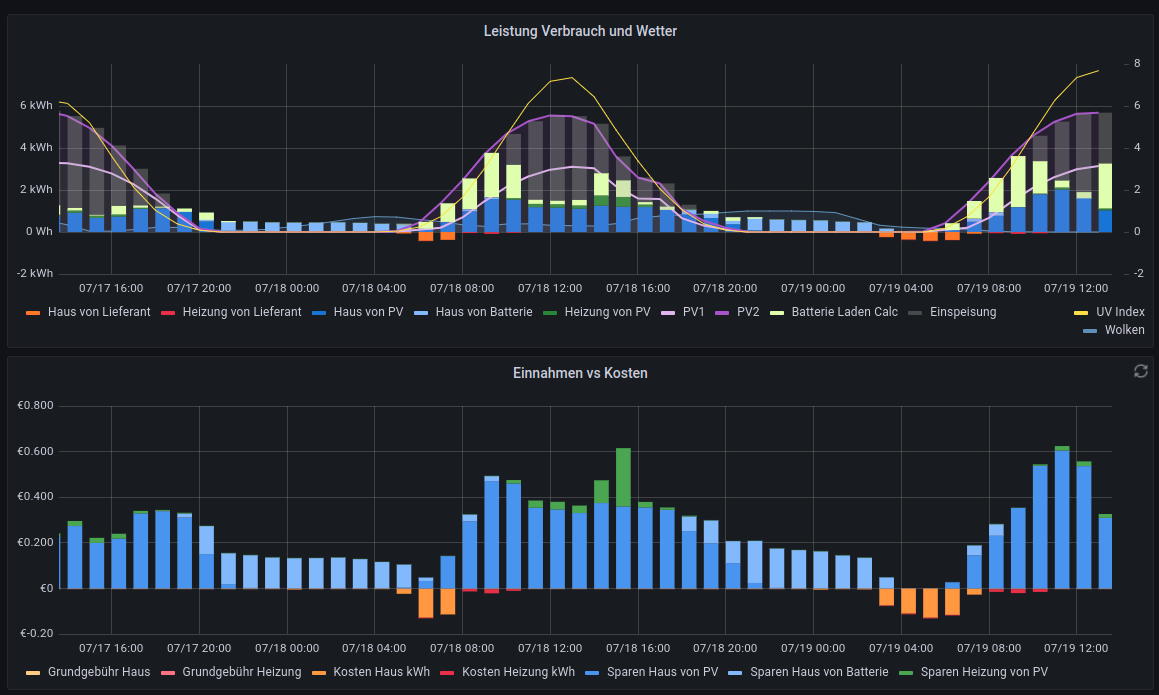
Grafana
Build interactive dashboards with Grafana. Visualize Data out of currently 139 supported Data sources which include:
By it's plugin Infrastructure nearly every known Datasource can be vizualized.
Example? Here!
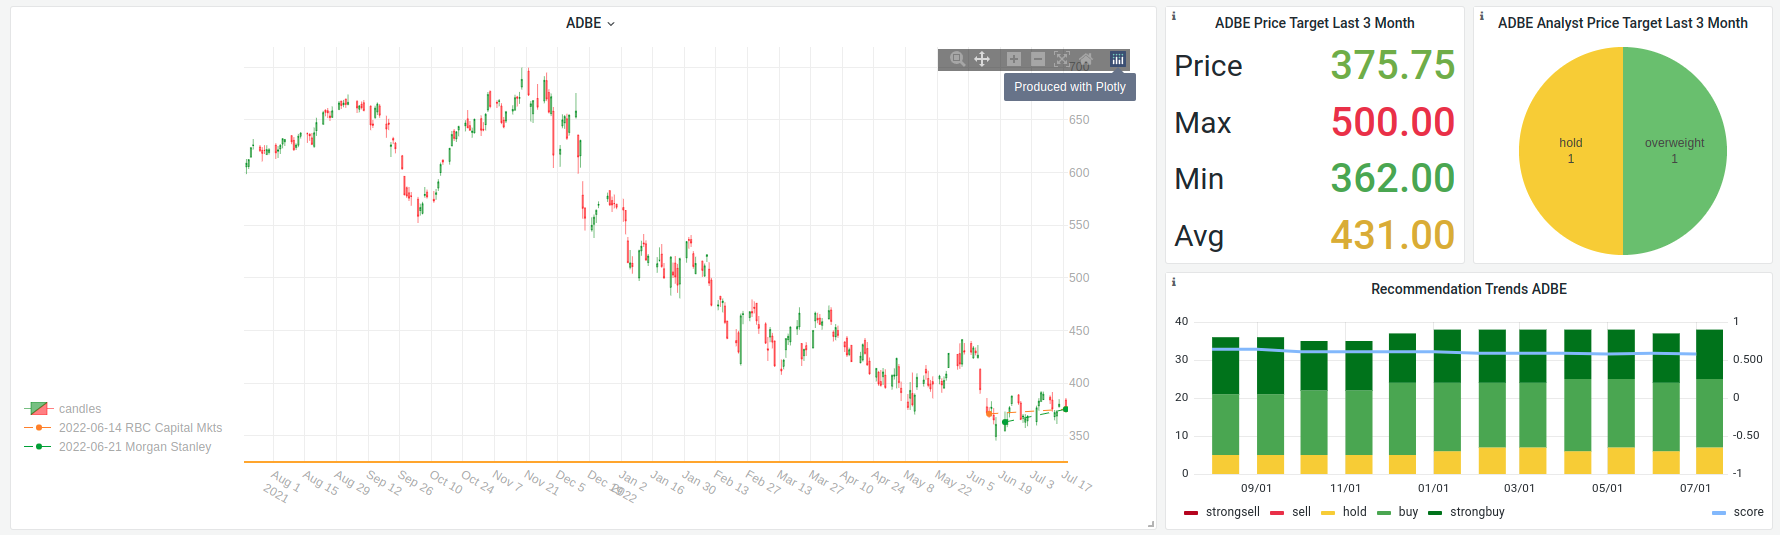
Plotly
Plotly is a Framework for Data Visualization. It has a lot of Libraries for different Languages. Want to include some nice Graphs on your website? Look at Plotly Javascript Library. Want to render on server side or render graphs in your python application? Look at Plotly Python Library
Grafana Plugin
I use Plotly as Plugin for GRafana. This make Grafana Graph Plotting possibilities extremely huge.